GUIDE TO SEATTLE CITIES AND NEIGHBORHOODS
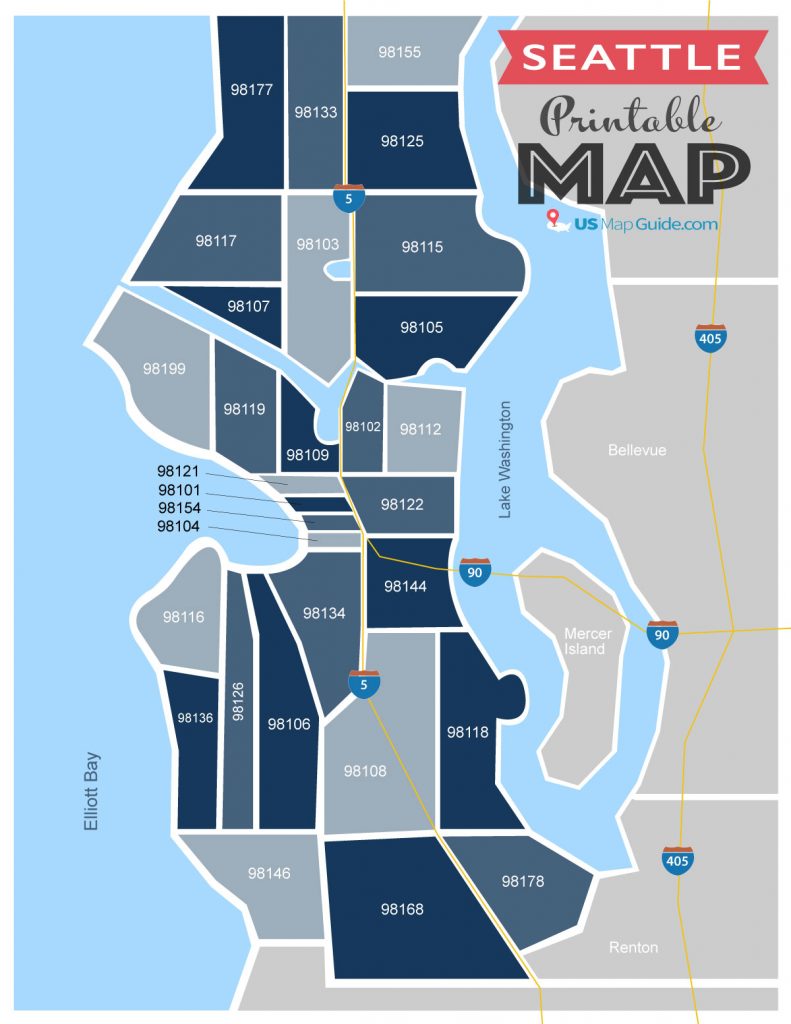
Below is an interactive Seattle zip code map. Your complete guide to the Seattle area. Hover over any zip code below to highlight that area.
List of Zip Codes in Seattle WA
Search to find the locations of all Seattle zip codes on the zip code map above. Here is the complete list of all of the zip codes in King County, WA and the city/neighborhood in which the zip code is in: 98101 (SEATTLE), 98102 (SEATTLE), 98103 (SEATTLE), 98104 (SEATTLE), 98105 (SEATTLE), 98106 (SEATTLE), 98107 (SEATTLE), 98108 (SEATTLE), 98109 (SEATTLE), 98110 (SEATTLE), 98111 (SEATTLE), 98112 (SEATTLE), 98114 (SEATTLE), 98115 (SEATTLE), 98116 (SEATTLE), 98117 (SEATTLE), 98118 (SEATTLE), 98119 (SEATTLE), 98121 (SEATTLE), 98122 (SEATTLE), 98124 (SEATTLE), 98125 (SEATTLE), 98126 (SEATTLE), 98129 (SEATTLE), 98131 (SEATTLE), 98132 (SEATTLE), 98133 (SEATTLE), 98134 (SEATTLE), 98136 (SEATTLE), 98138 (SEATTLE), 98144 (SEATTLE), 98145 (SEATTLE), 98146 (SEATTLE), 98148 (SEATTLE), 98151 (SEATTLE), 98154 (SEATTLE), 98155 (SEATTLE), 98158 (SEATTLE), 98160 (SEATTLE), 98161 (SEATTLE), 98164 (SEATTLE), 98166 (SEATTLE), 98168 (SEATTLE), 98170 (SEATTLE), 98171 (SEATTLE), 98174 (SEATTLE), 98177 (SEATTLE), 98178 (SEATTLE), 98181 (SEATTLE), 98184 (SEATTLE), 98185 (SEATTLE), 98188 (SEATTLE), 98190 (SEATTLE), 98191 (SEATTLE), 98195 (SEATTLE), 98198 (SEATTLE), 98199 (SEATTLE).
Printable Seattle Zip Code Map