GUIDE TO LOS ANGELES ZIP CODES AND NEIGHBORHOODS
Below is an updated Los Angeles zip code map. Your complete guide to the Los Angeles area.

List of ALL Zip Codes in Los Angeles CA
Search to find the locations of all Los Angeles zip codes on the zip code map above. Here is the complete list of all of the zip codes in Los Angeles County, CA and the area in which the zip code is in
Northwest Country (Los Angeles) Zip Codes
91311, 91321, 91326, 91350, 91351, 91354, 91355, 91381, 91382, 91384, 91387, 91390, 93243, 93532, 93536.
Antelope Valley (Los Angeles) Zip Codes
92397, 93510, 93523, 93534, 93535, 93536, 93543, 93544, 93550, 93551, 93552, 93553, 93591.
Angeles Forest (Los Angeles) Zip Codes
91001, 91011, 91016, 91024, 91042, 91342, 91387, 91390, 91702, 91711, 91741, 91750, 91759, 92397, 93510, 93543, 93550, 93553, 93563.
San Fernando Valley (Los Angeles) Zip Codes
91040, 91304, 91306, 91307, 91311, 91316, 91324, 91325, 91326, 91330, 91331, 91335, 91340, 91342, 91343, 91344, 91345, 91352, 91356, 91364, 91367, 91401, 91402, 91403, 91405, 91406, 91411, 91423, 91436, 91501, 91502, 91504, 91505, 91506, 91522, 91523, 91601, 91602, 91604, 91605, 91606, 91608.
The Verdugos (Los Angeles) Zip Codes
91011, 91040, 91042, 91101, 91103, 91104, 91105, 91106, 91107, 91201, 91202, 91203, 91204, 91205, 91206, 91207, 91208, 91210, 91214.
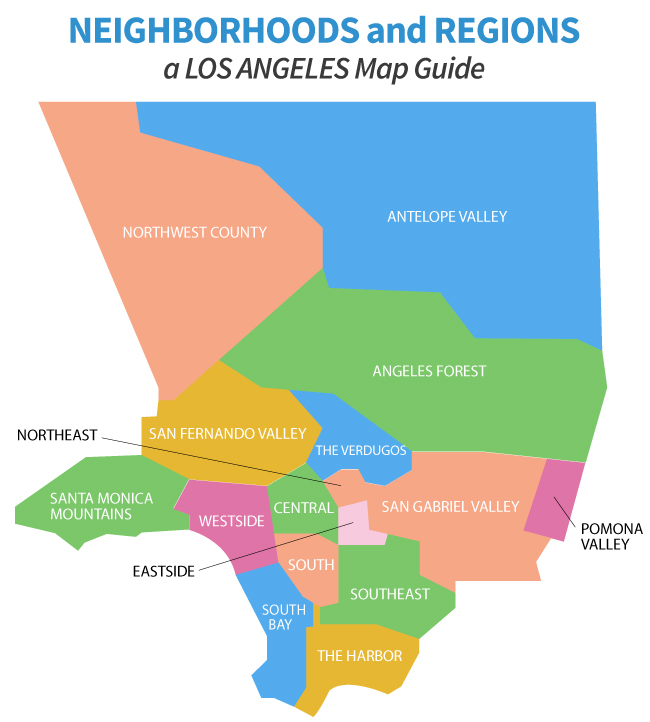
The San Gabriel Valley (Los Angeles) Zip Codes
90601, 90602, 90603, 90605, 90631, 91006, 91007, 91008, 91010, 91016, 91024, 91030, 91108, 91702, 91706, 91722, 91723, 91724, 91731, 91732, 91733, 91741, 91744, 91745, 91746, 91748, 91754, 91756, 91765, 91770, 91773, 91775, 91776, 91780, 91789, 91790, 91791, 91792, 91801, 91803, 92821, 92823.
The Pomona Valley (Los Angeles) Zip Codes
91711, 91750, 91766, 91767, 91768, 91773.
Northeast Los Angeles Zip Codes
90031, 90032, 90041, 90042, 90065, 91204, 91205.
Central Los Angeles Zip Codes
90004, 90005, 90006, 90012, 90013, 90014, 90015, 90017, 90019, 90021, 90026, 90027, 90028, 90035, 90036, 90038, 90039, 90046, 90048, 90057, 90068, 90069, 90071.
The Eastside (Los Angeles) Zip Codes
90022, 90023, 90031, 90032, 90033, 90063.
The Westside (Los Angeles) Zip Codes
90024, 90025, 90034, 90035, 90049, 90056, 90064, 90066, 90067, 90073, 90077, 90094, 90210, 90212, 90230, 90232, 90272, 90291, 90292, 90401, 90402, 90403, 90404, 90405.
South Los Angeles Zip Codes
90001, 90002, 90003, 90007, 90008, 90011, 90016, 90018, 90037, 90043, 90044, 90047, 90059, 90061, 90062, 90089, 90220, 90305.
Southeast Los Angeles Zip Codes
90040, 90058, 90201, 90220, 90221, 90240, 90241, 90242, 90255, 90262, 90270, 90280, 90604, 90605, 90606, 90638, 90640, 90650, 90660, 90670, 90703, 90706, 90723.
Santa Monica Mountains (Los Angeles) Zip Codes
90265, 90290, 91301, 91302, 91361, 91362.
South Bay (Los Angeles) Zip Codes
90045, 90245, 90249, 90250, 90254, 90260, 90261, 90266, 90274, 90275, 90277, 90278, 90293, 90301, 90302, 90303, 90304, 90501, 90503, 90504, 90505, 90506, 90717.
The Harbor (Los Angeles) Zip Codes
90220, 90221, 90502, 90710, 90712, 90713, 90715, 90716, 90731, 90732, 90744, 90745, 90746, 90755, 90802, 90803, 90804, 90805, 90806, 90807, 90808, 90810, 90813, 90814, 90815, 90822, 90831, 90840, 90846.
Los Angeles Zip Code Map Printable
Other Popular Zip Code Maps
| Atlanta Zip Code | Boston Zip Code | Chicago Zip Code |
| Miami Zip Code | Las Vegas Zip Code | Los Angelas Zip Code |
| Orlando Zip Code | Philadelphia Zip Code | Portland Zip Code |
Nearby Area Codes: 707 Area Code | 510 Area Code